Collecting air, soil, tree, and vegetation data
Forest health monitoring is done in jack pine ecosystems, as the soil in these tree stands was thought to be very sensitive to the input of acidifying compounds. All forest monitoring sites fit the same ecosystem criteria so data can be compared across the region.
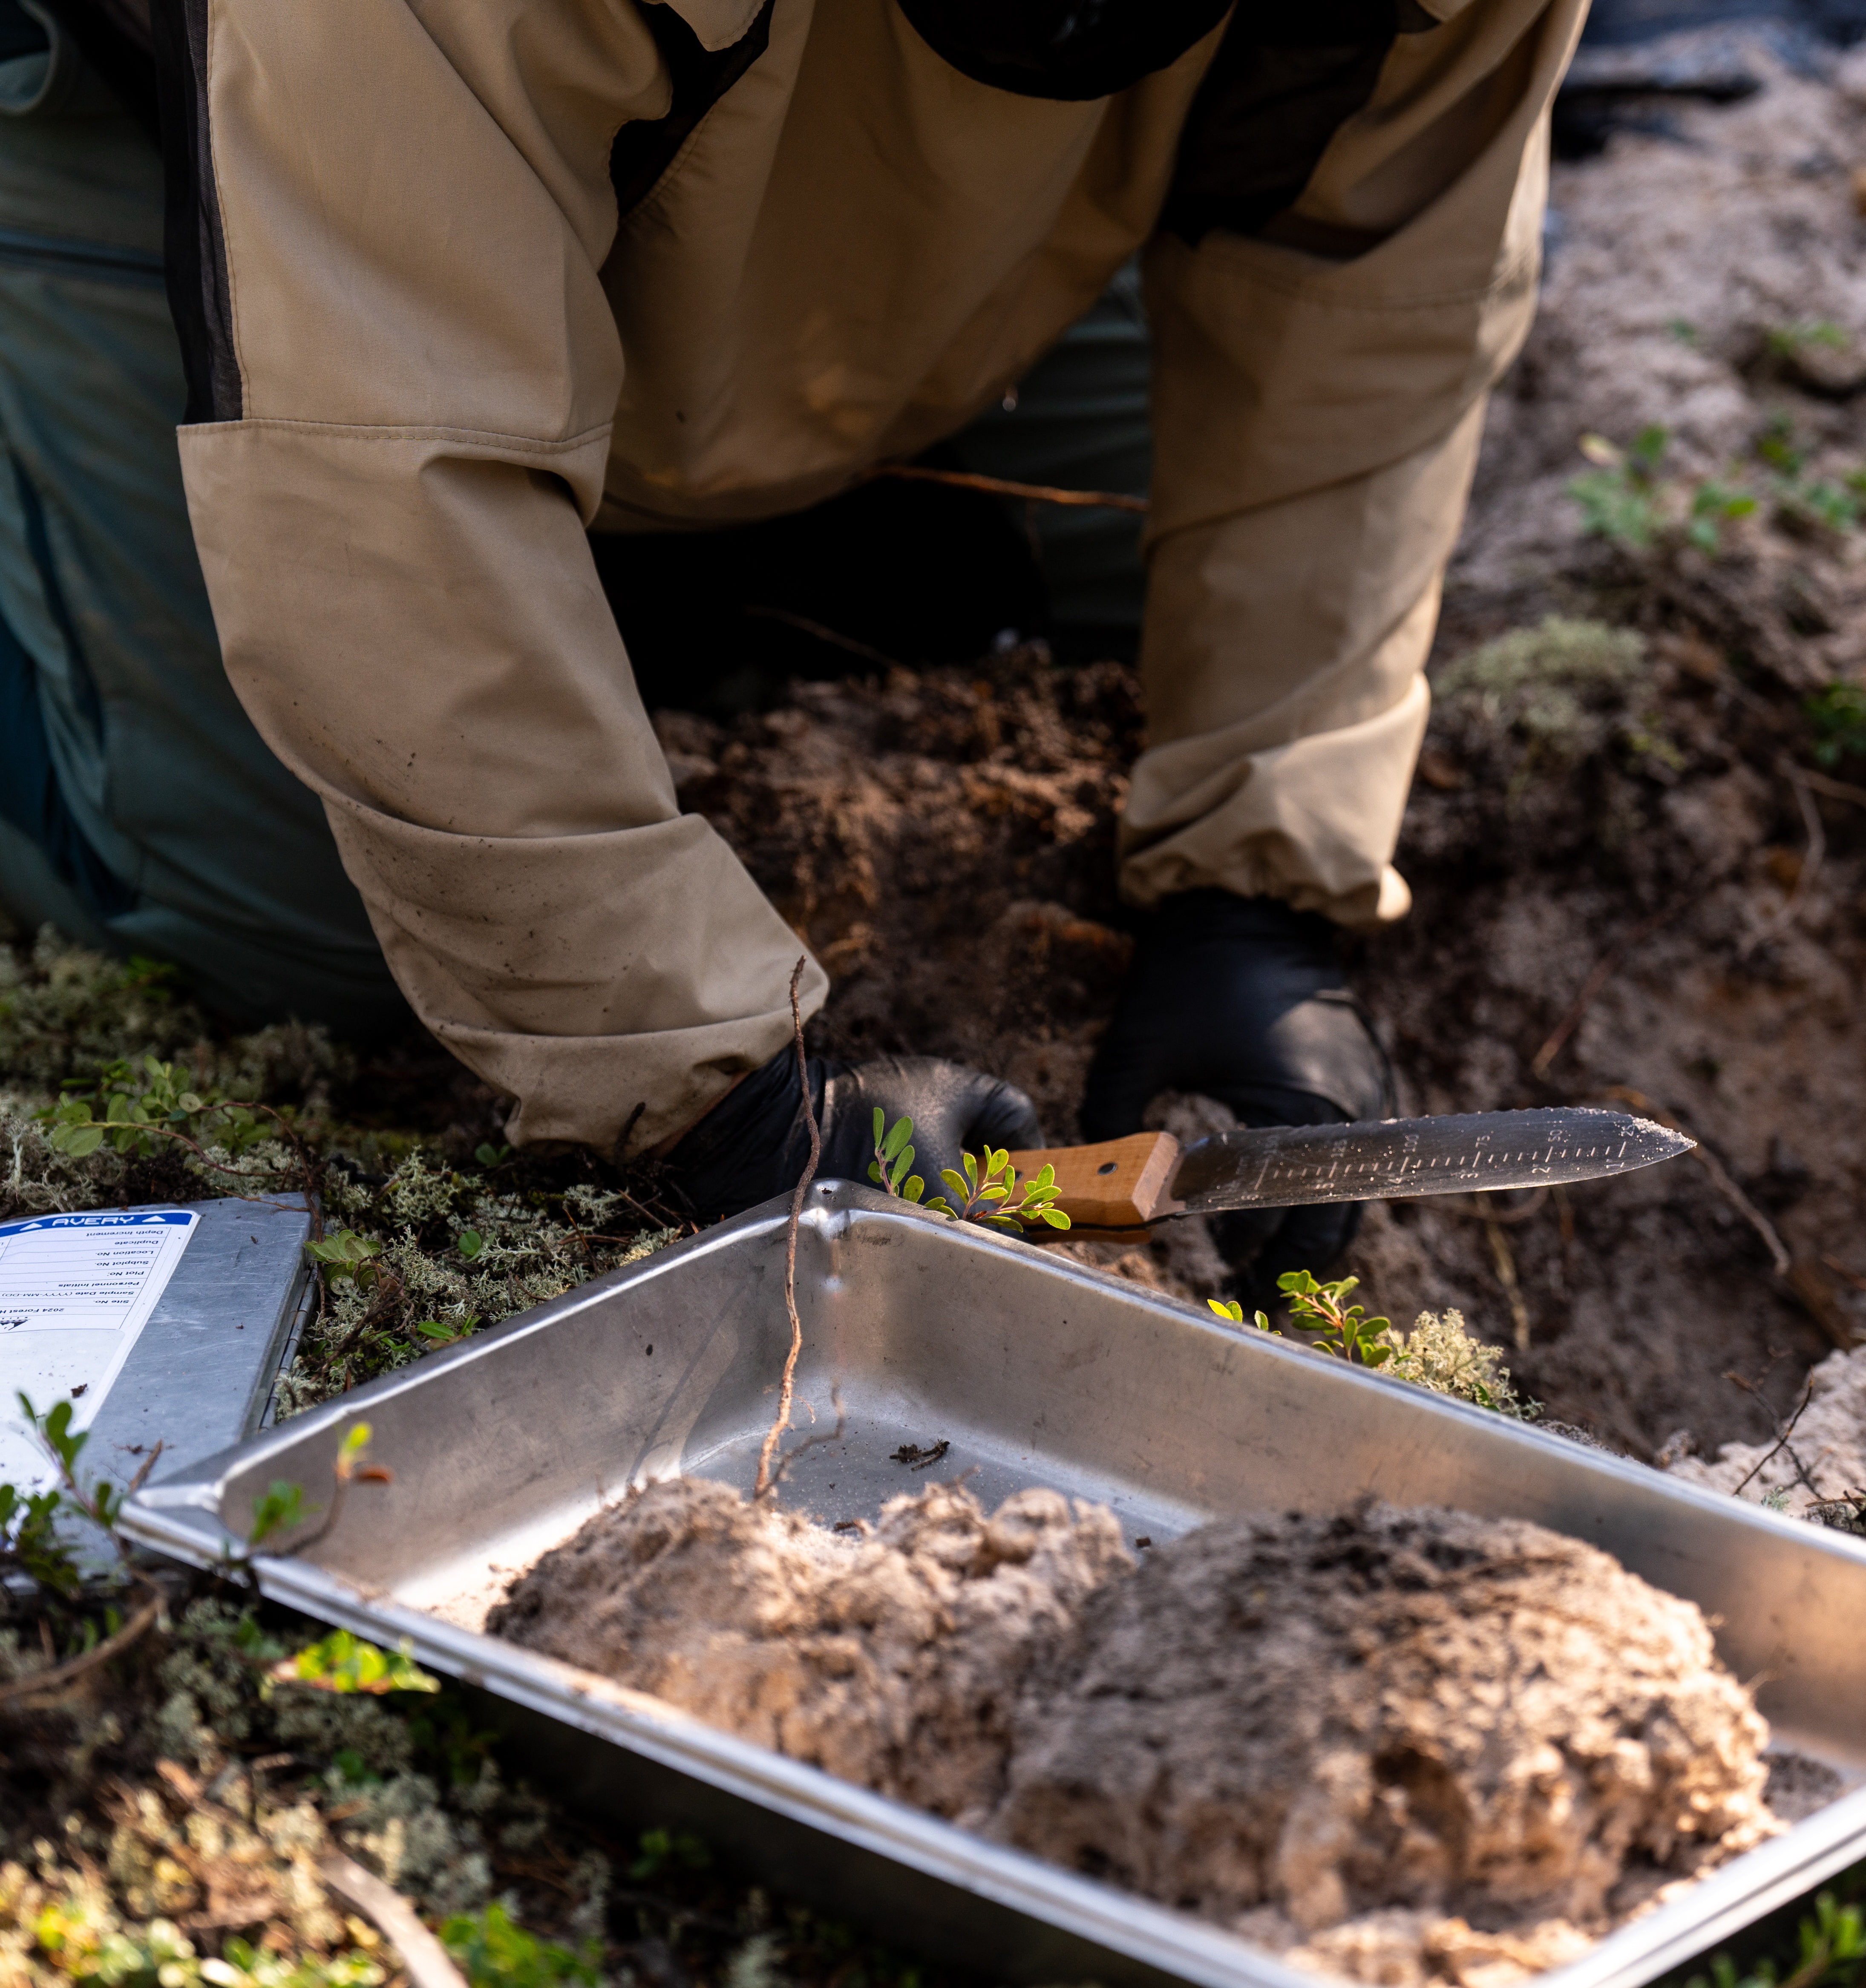
Soil is sampled by depth at each monitoring site for chemical analysis.
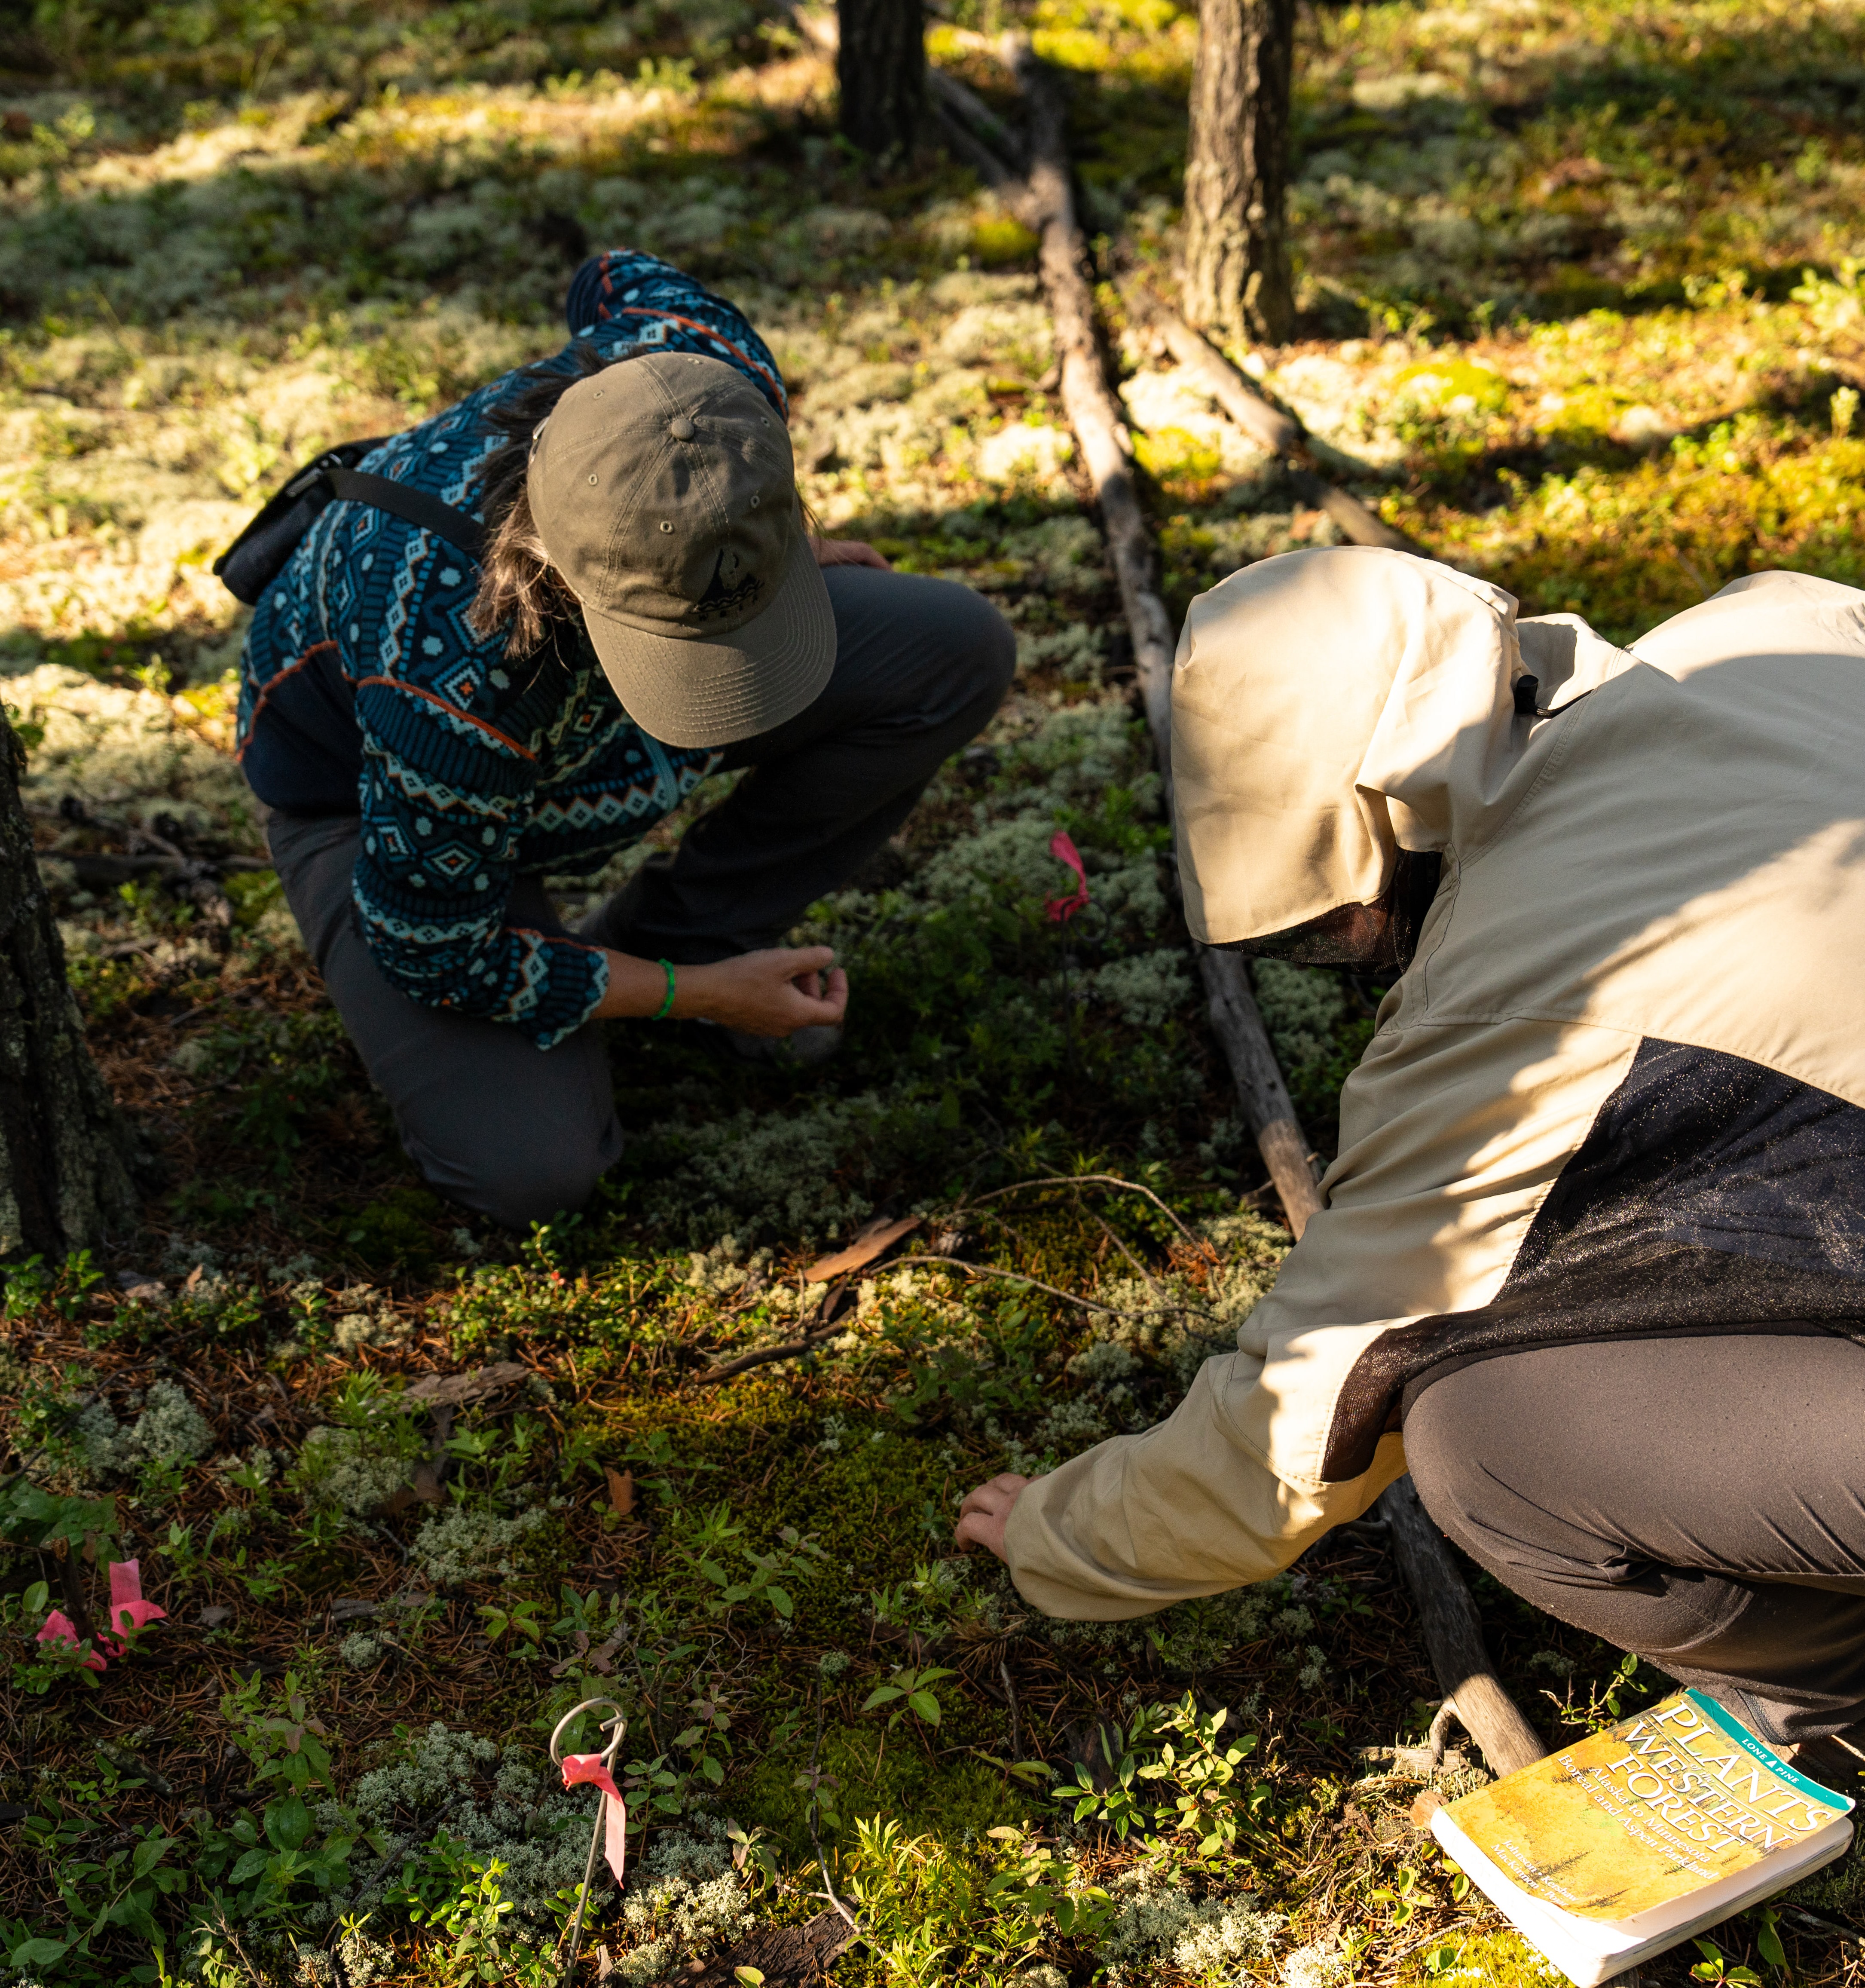
Plots are staked out on the forest floor and the amount of each species present in the plot is recorded.
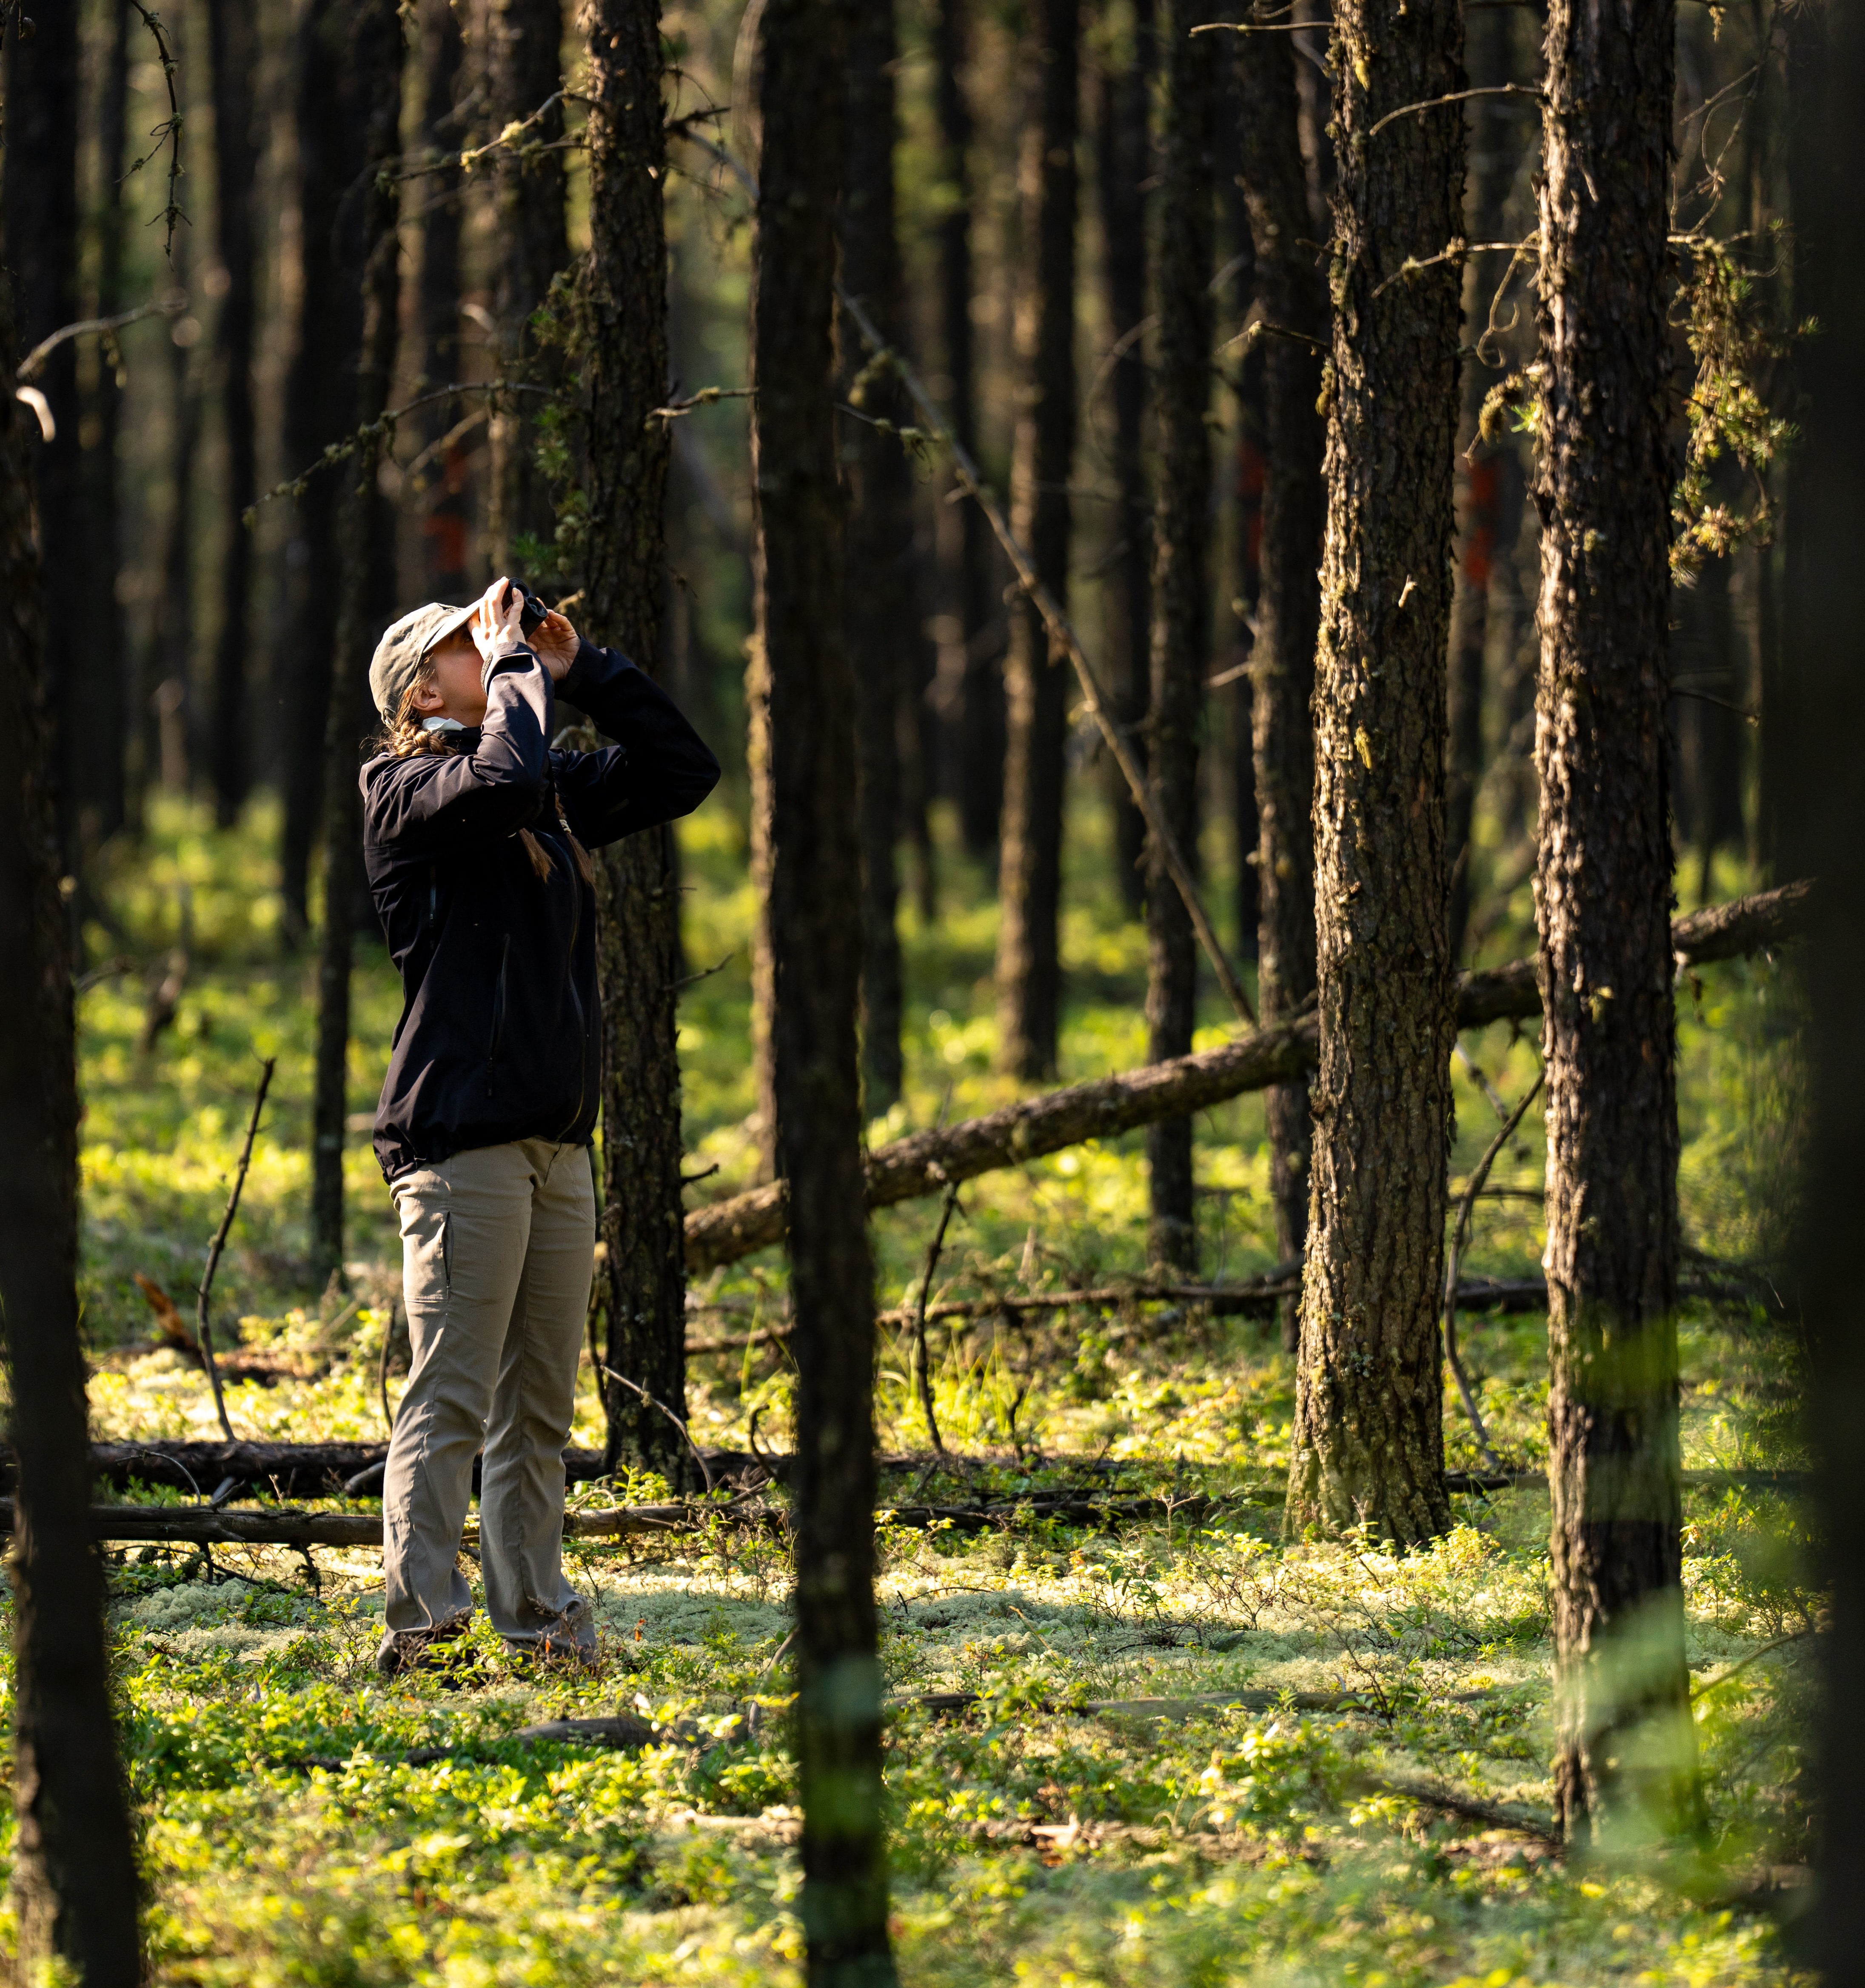
Measurements such as height and diameter are collected to understand tree growth and needles are sampled for chemical analysis.
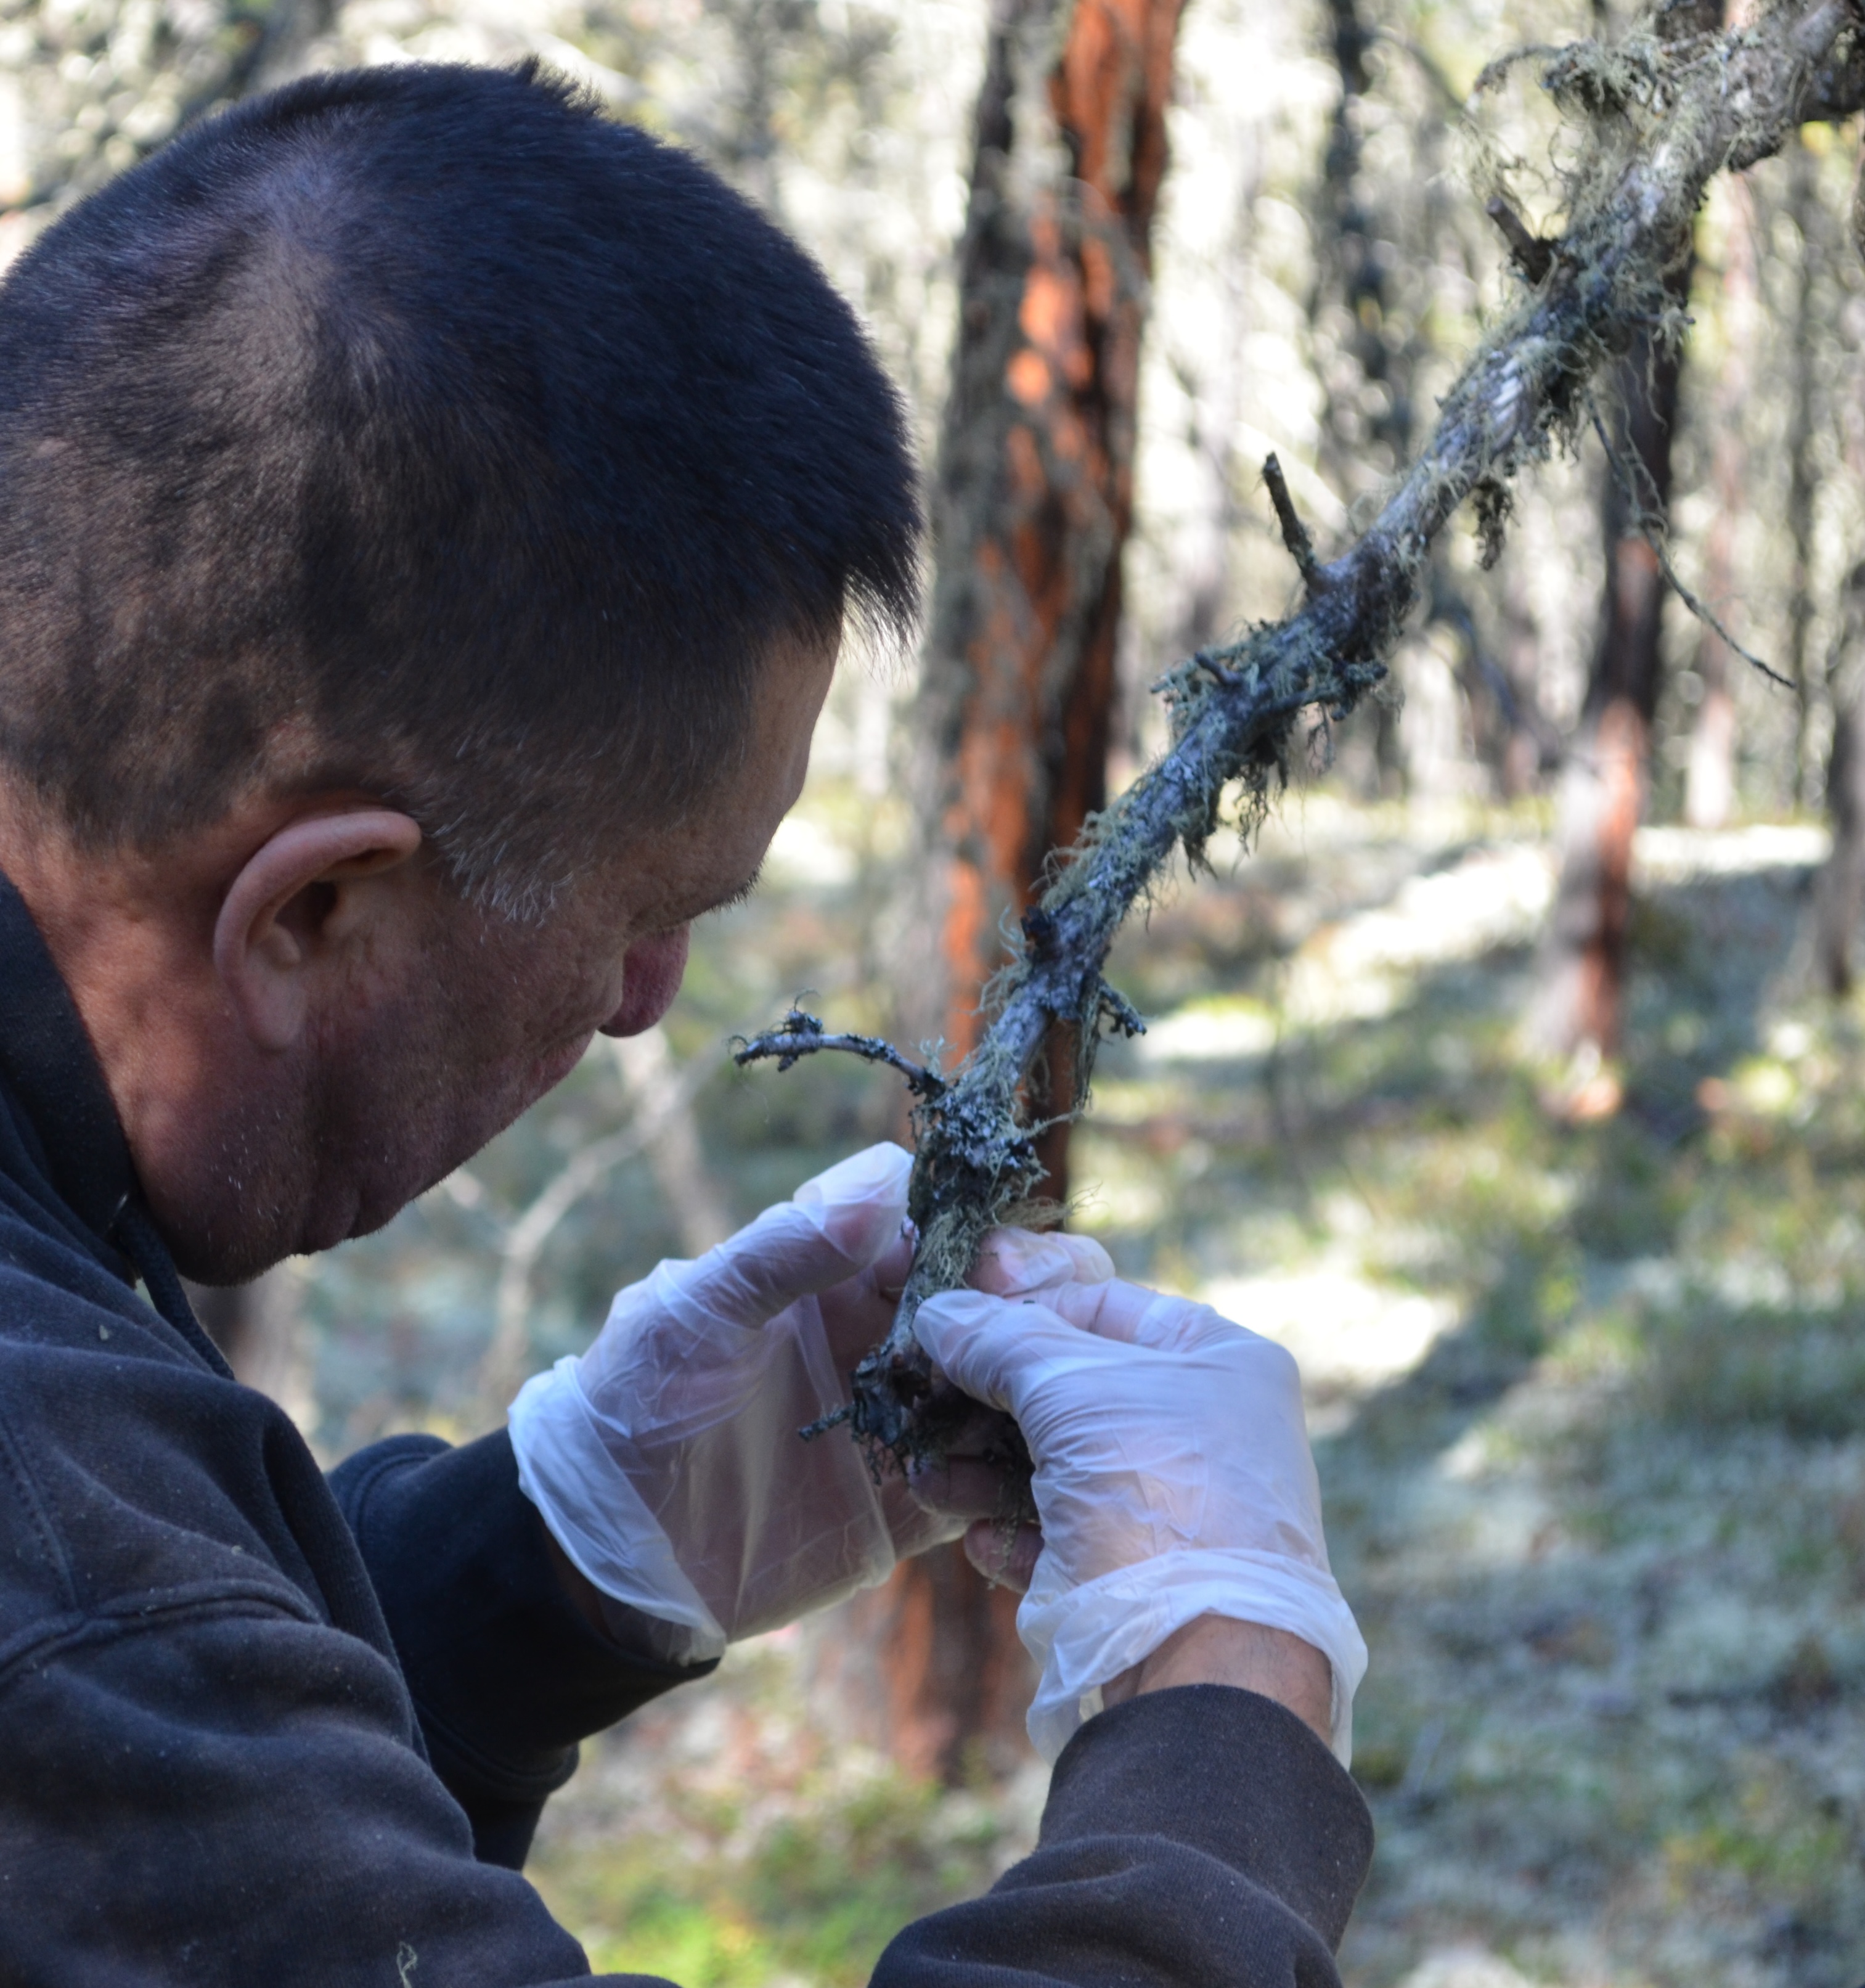
Samples are collected for chemical analysis as lichen get most of their nutrients from the air.
Soil is sampled by depth at each monitoring site for chemical analysis.
Plots are staked out on the forest floor and the amount of each species present in the plot is recorded.
Measurements such as height and diameter are collected to understand tree growth and needles are sampled for chemical analysis.
Samples are collected for chemical analysis as lichen get most of their nutrients from the air.
Deposition monitoring measures a broad range of pollutants using several different methods. Where possible, deposition monitoring is done at the same location as the forest health monitoring.
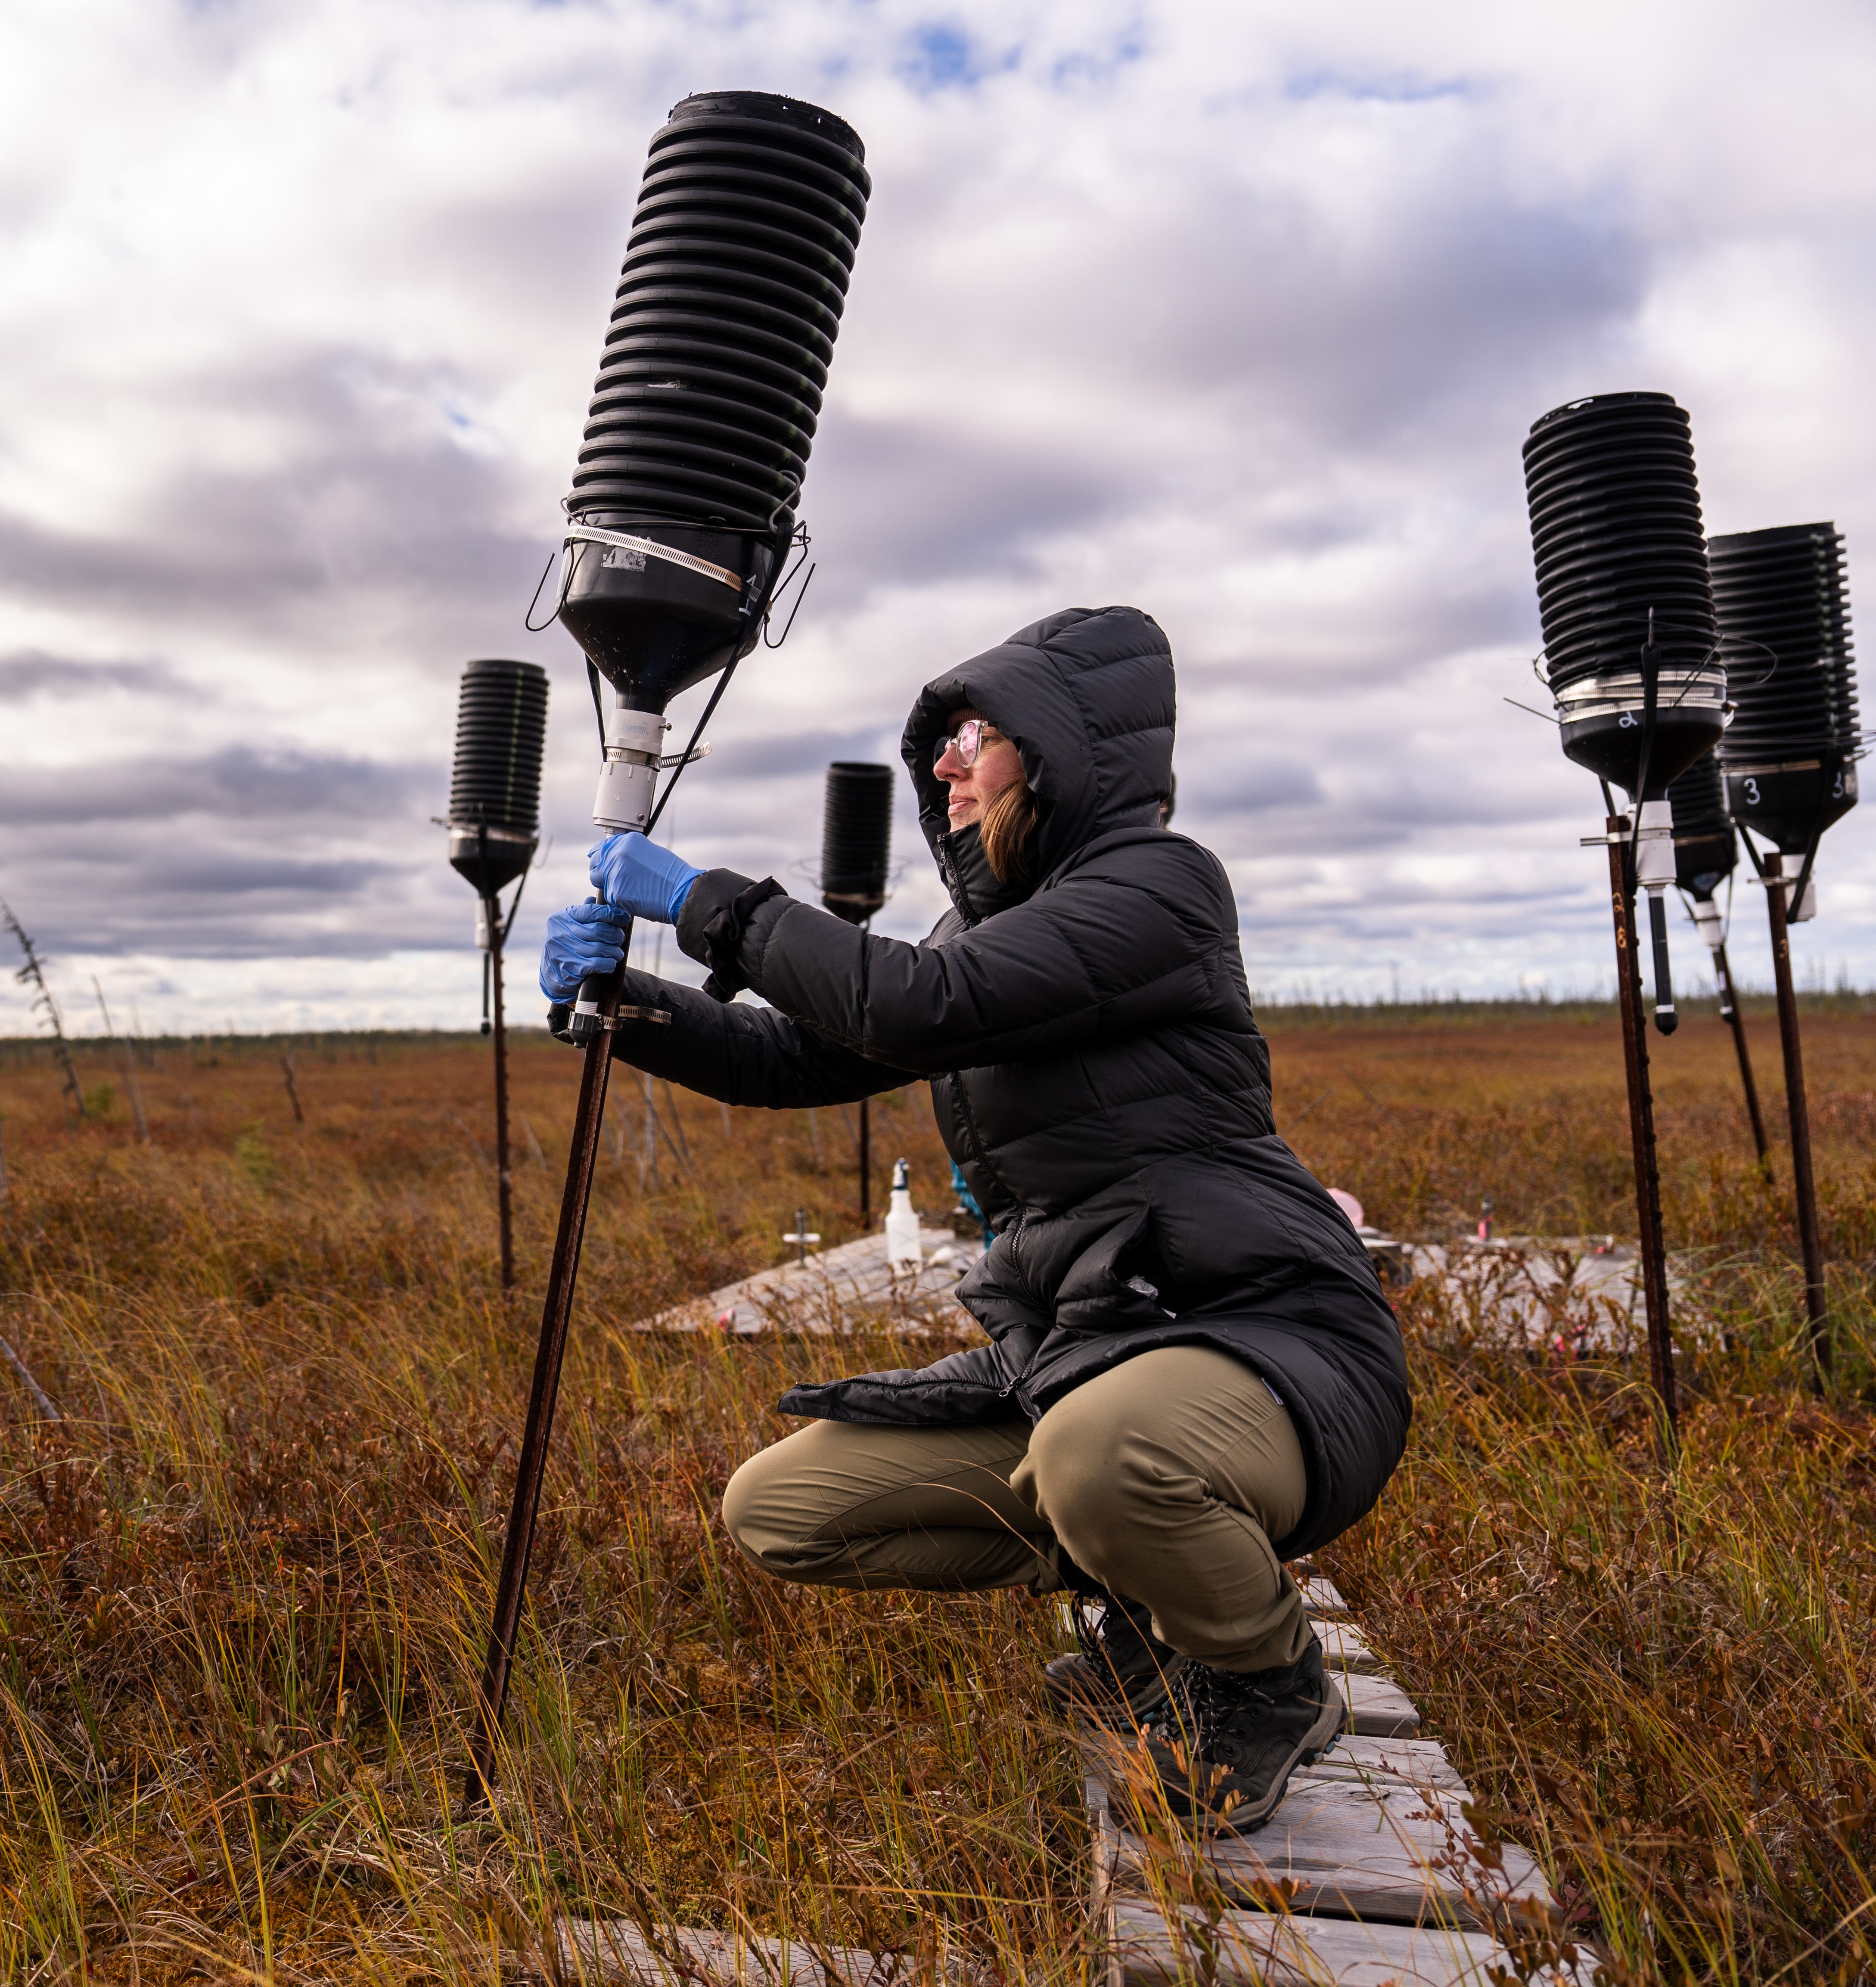
Sampling equipment that measures ions, such as base cations like calcium and sodium. The equipment is placed in both jack pine forest stands and in nearby open areas.
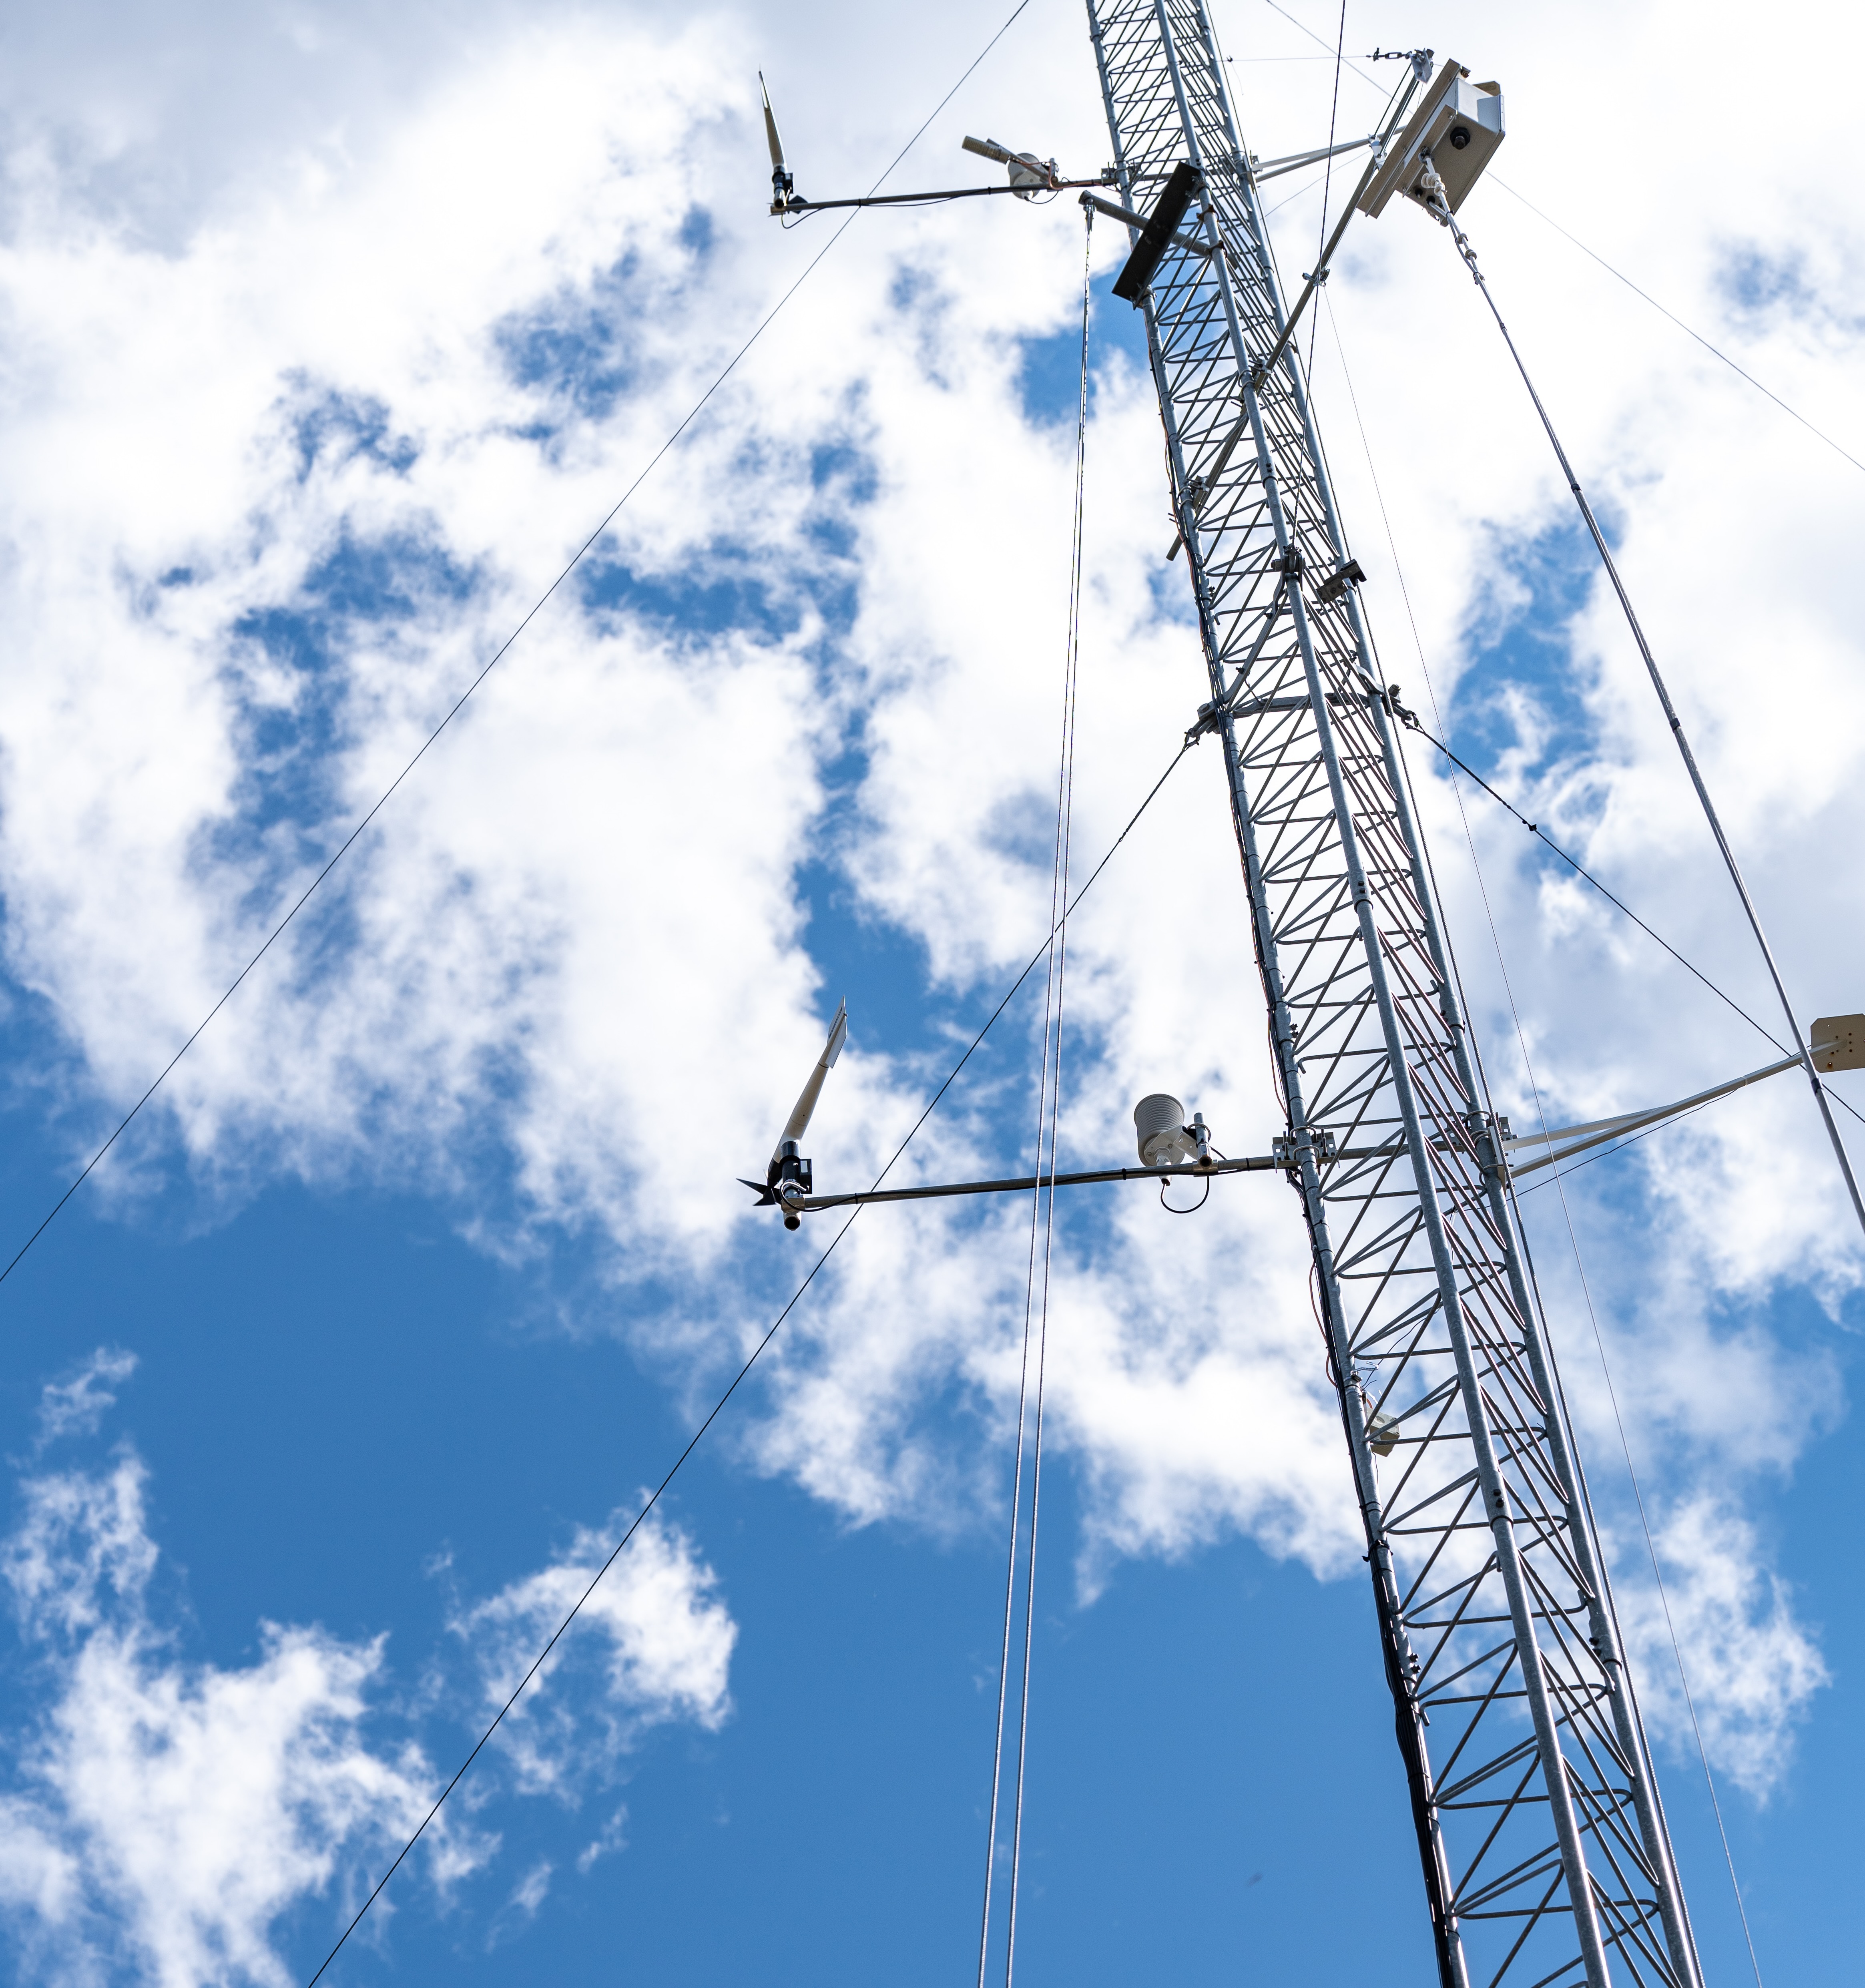
Sampling equipment that actively pulls in air and measures key atmospheric pollutants. The equipment is placed on tall towers.
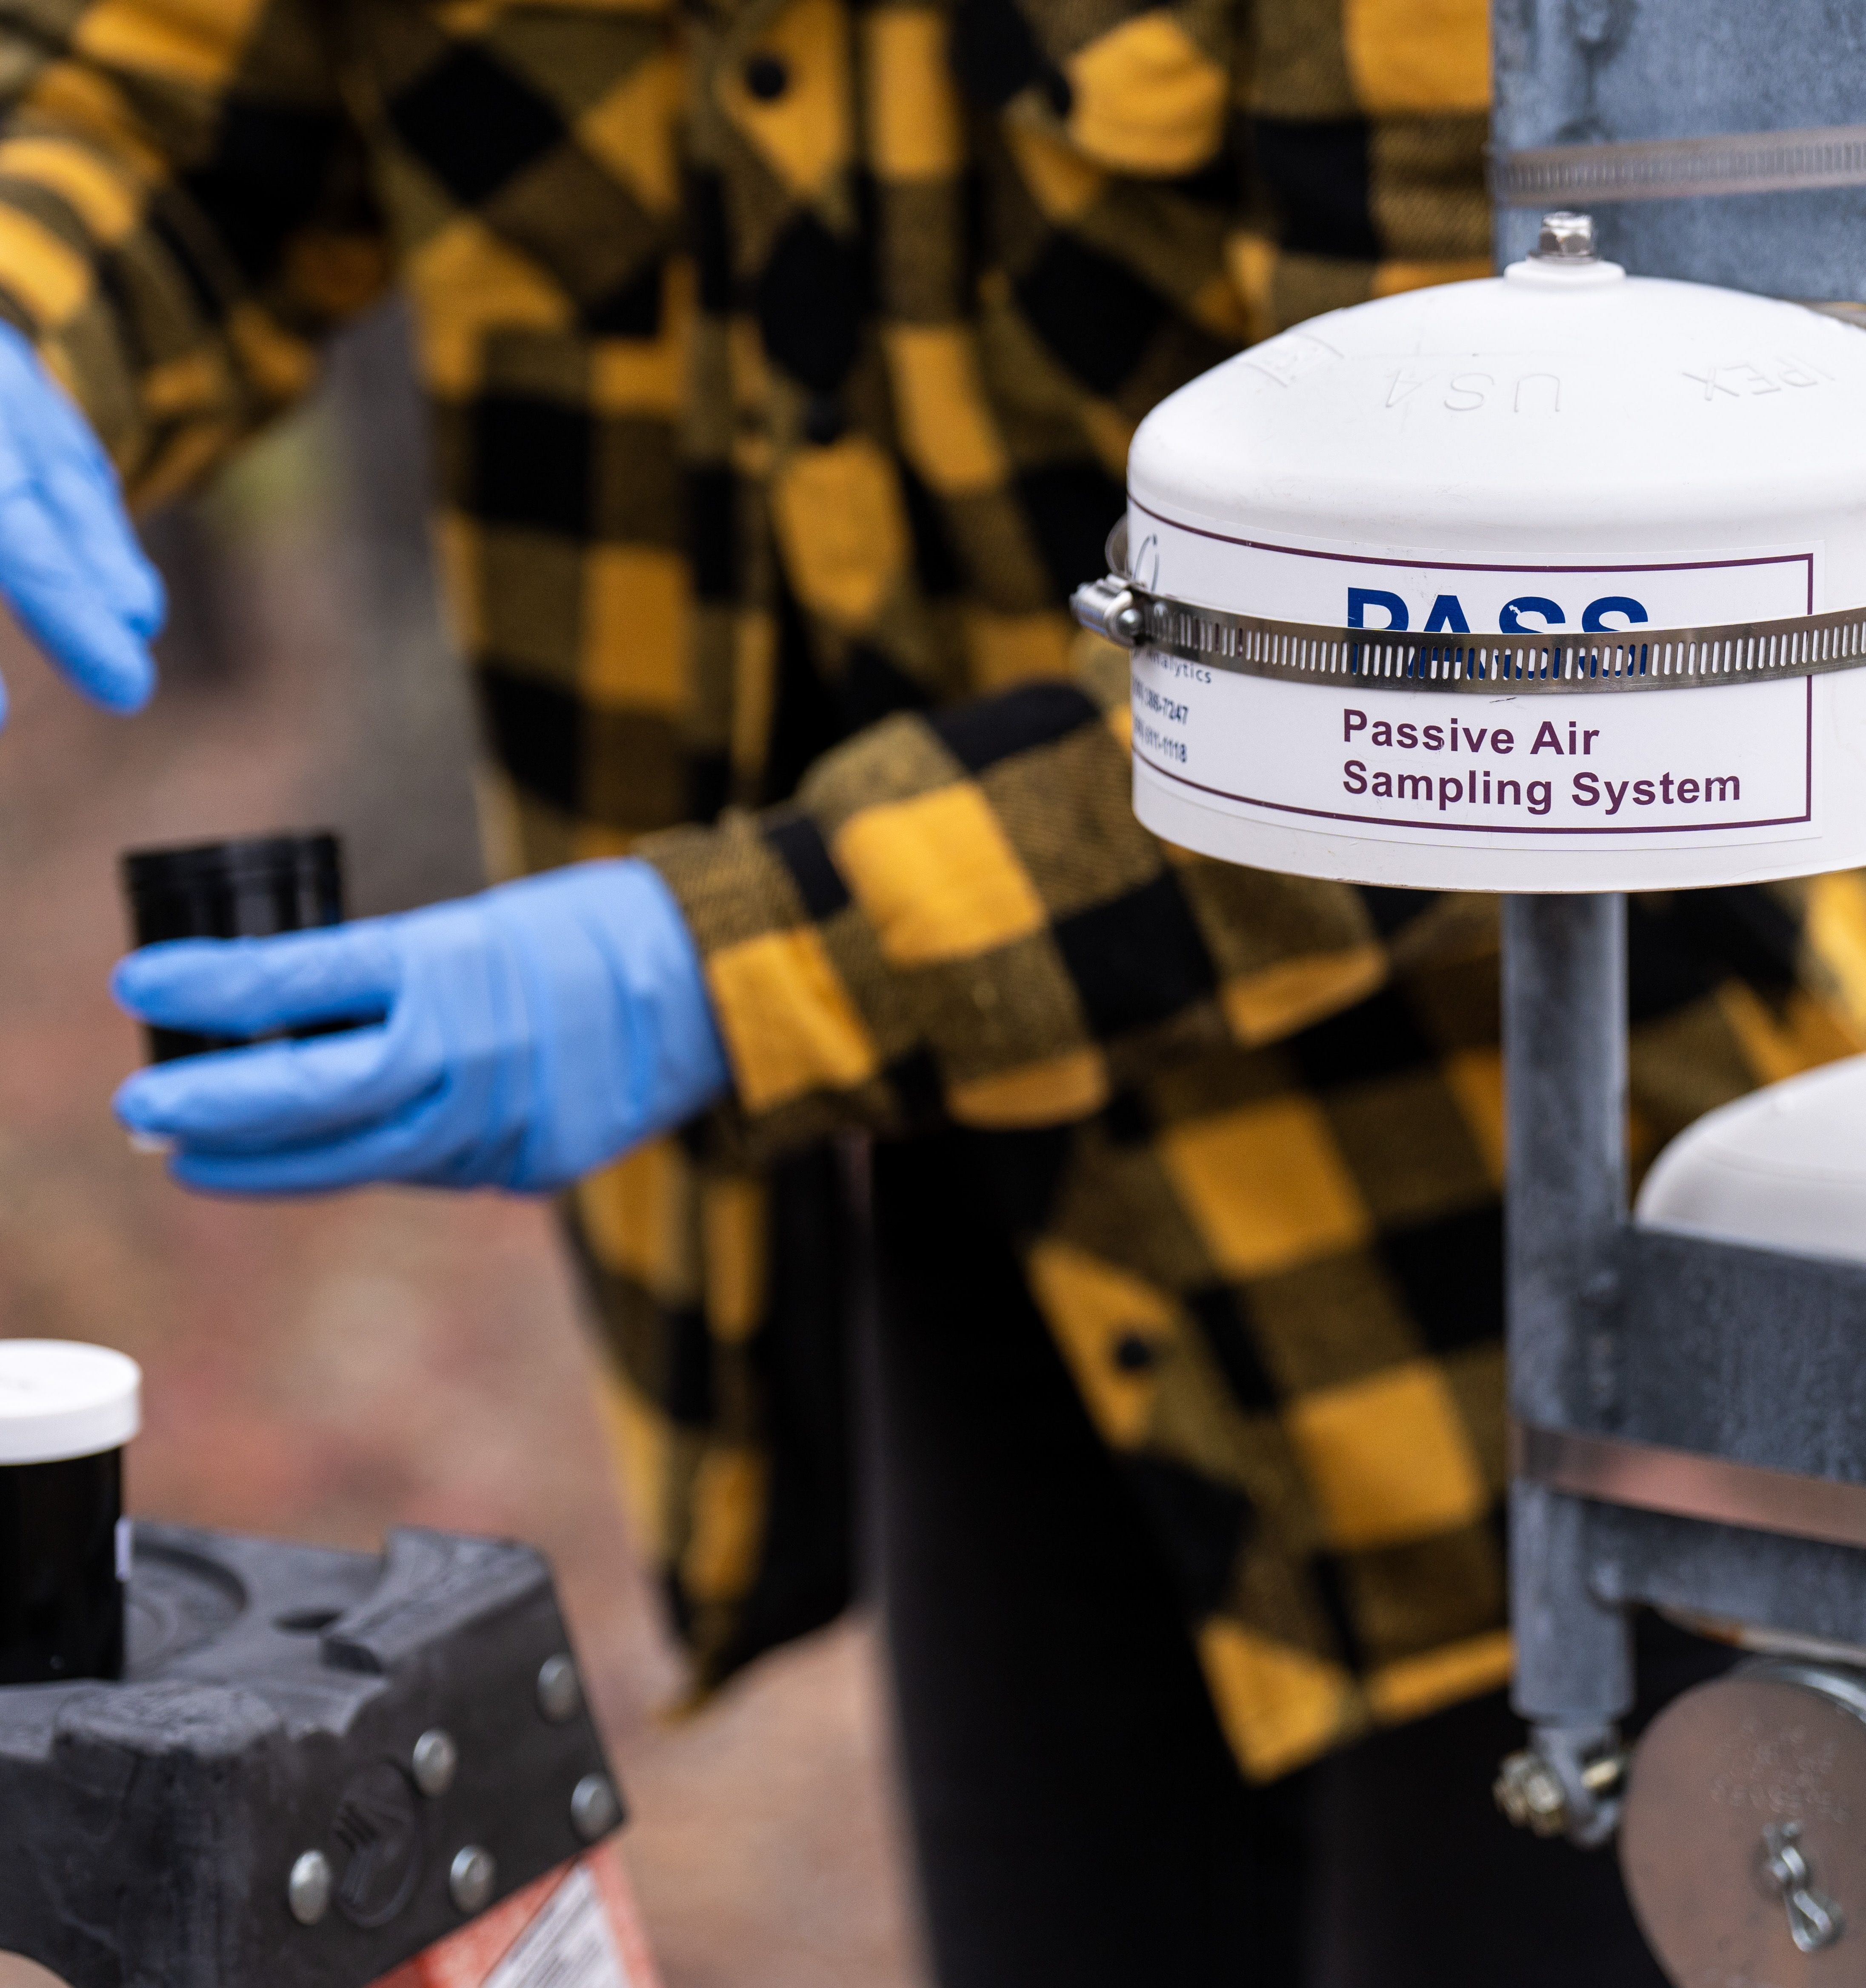
Sampling equipment that passively measures key atmospheric pollutants as air flows past a filter. The equipment is placed on tall towers near the denuders.
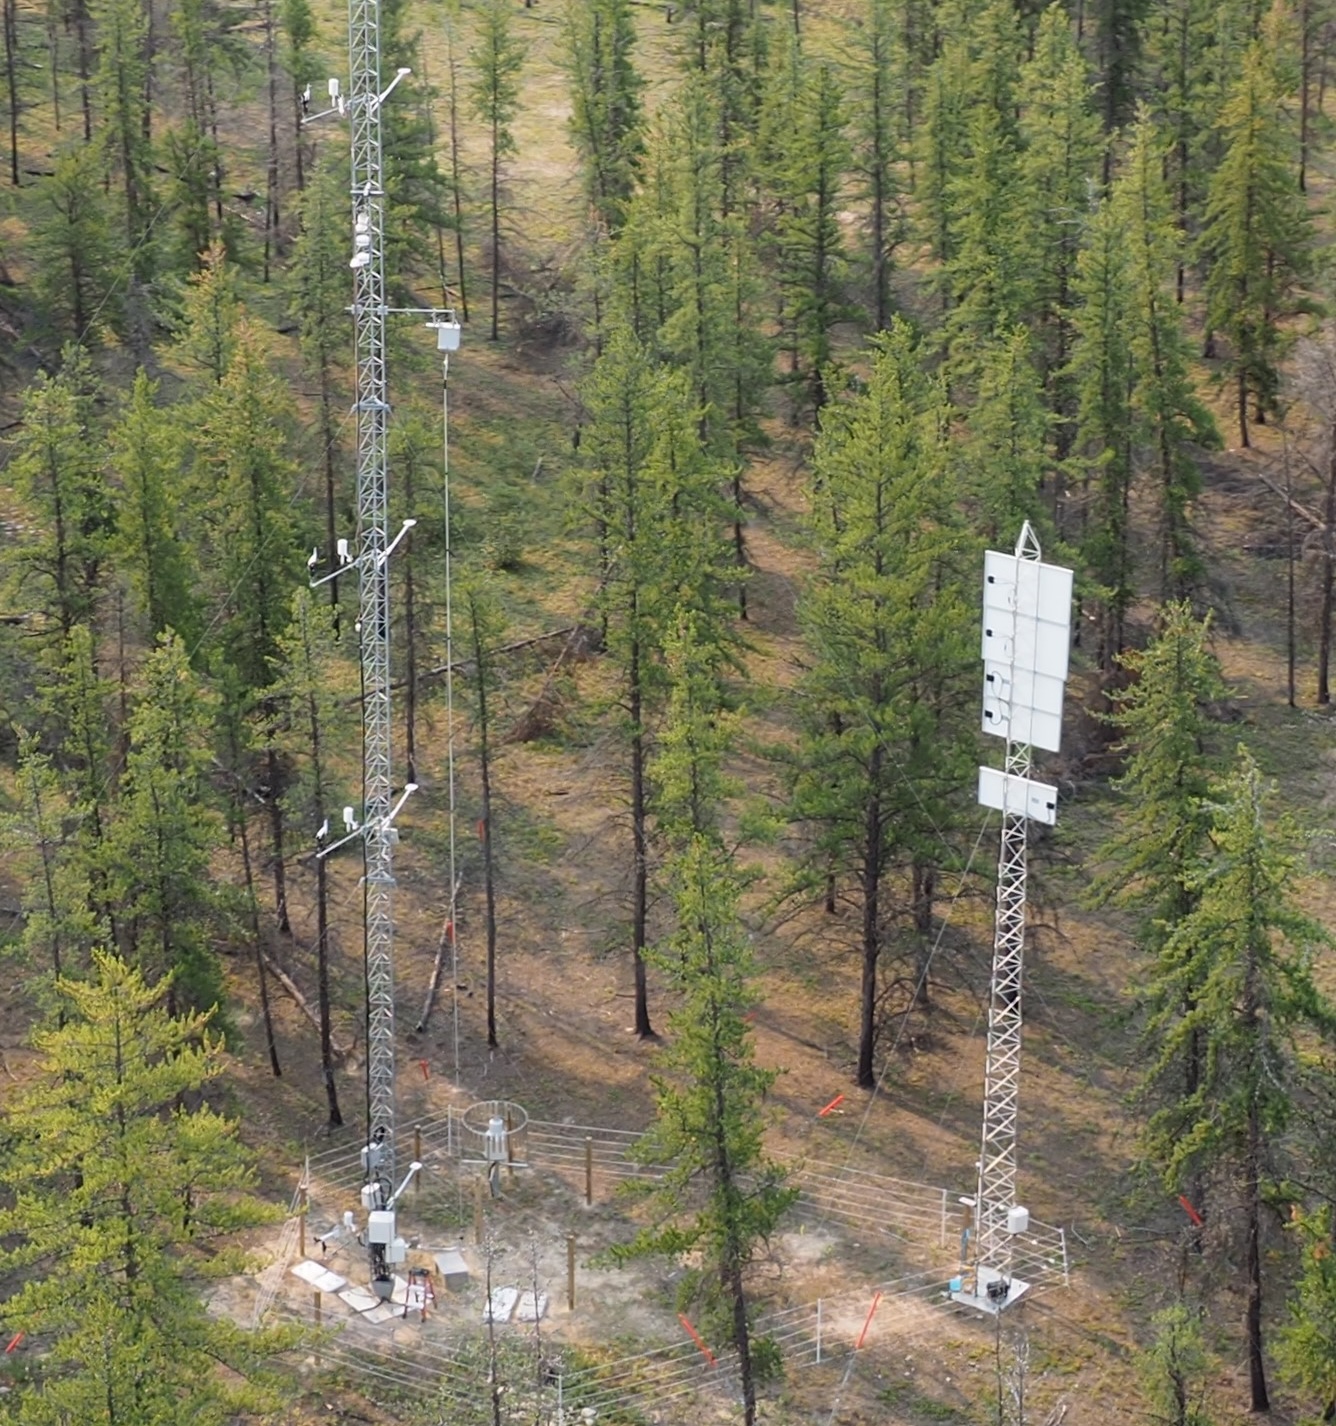
Sensors are placed on 30m tall towers to provide meteorological measurements, such as wind, that are used to calculate deposition patterns.
Sampling equipment that measures ions, such as base cations like calcium and sodium. The equipment is placed in both jack pine forest stands and in nearby open areas.
Sampling equipment that actively pulls in air and measures key atmospheric pollutants. The equipment is placed on tall towers.
Sampling equipment that passively measures key atmospheric pollutants as air flows past a filter. The equipment is placed on tall towers near the denuders.
Sensors are placed on 30m tall towers to provide meteorological measurements, such as wind, that are used to calculate deposition patterns.